What you all need to know about Chinese stock markets: Price-to-Earnings (Page 2 of 3)
July 1, 2015
*This article or the contents of this article was originally written on December 20, 2015, at Fudan University, Shanghai China.
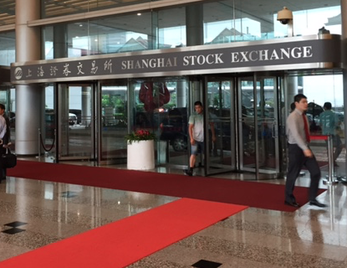 Entrance of the Shanghai Stock Exchange on June 26, 2015. Entrance of the Shanghai Stock Exchange on June 26, 2015.
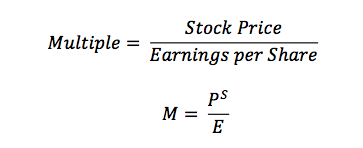
The premium is measured by “price-to-earnings ratio (PE)” and the ratio is simply calculated by dividing today’s stock price by a company’s earnings, which are generally past 12 months’ earnings (trailing twelve months TTM). In the Wall Street, this PE ratio is often called, “PE multiple” or simply “multiple” because one says how many times earnings an investor is willing to pay. Lower the ratio, cheaper the stock is, vice versa. Growth potential companies, such as technology companies, tend to have higher PE ratios because investors are willing to pay more premium for their future potential growth while non-cyclical companies, such as food and medical companies, tend to have lower PE ratios because they are relatively less economic sensitive.
Although PE is often used for analyzing an individual stock valuation but it can be used for a market as an overall. The most popular index in the United States, the S&P 500, which is consisted of 500 top companies in the U.S., also has its PE and the PE is currently 14.53 (as of Dec. 13, 2012) according to Bloomberg data. In order to analyze the market valuation, PE can be utilized through both comparative analysis and historical analysis. In the United States, the stock market history is long enough and market analysts tend to utilize a historical PE analysis. In China, its stock market history is relatively young with only 30 years. The historical analysis could be a choice to analyze how the Chinese stock market is valued but here, comparative analysis is applicable. The PE ratio in the Wall Street is often called, “PE multiple,” or simply “multiple” because it tells how many times investors are willing to pay for their earnings and the multiple depends on the growth rate of earnings. Therefore, the equation is as follow: Thus, multiple is the real price of stock, which is equal to P times M, because it is the only way to make a relative comparison, apple-to-apple, to determine which stock is expensive or cheap. Then, this multiple can apply to the overall stock market to compare whether the Chinese stock market is overpriced or underpriced relative to the U.S. market although the growth rate of economy should priced into the multiple. Looking at the Table 2, the PE ratios of the SSE in the early 2000s were relatively high at well above 50 points. That indicates that the SSE was trading at higher premium. However, the PE ratio went all the way down to 15.42 in 2005 along with the SSE index. Since the PE is calculated by dividing share price by earnings; therefore, the PE falls if stock price falls.
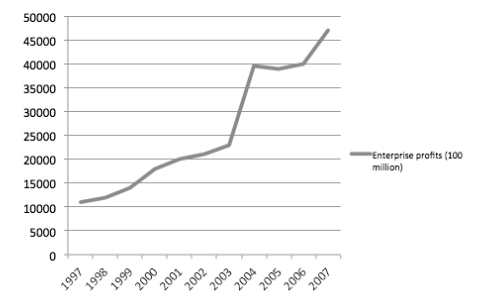
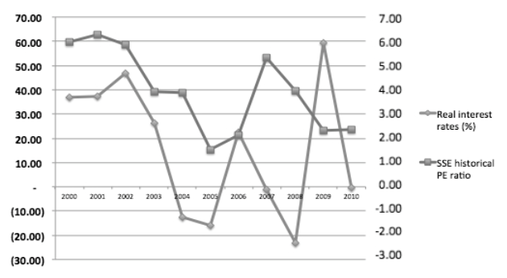
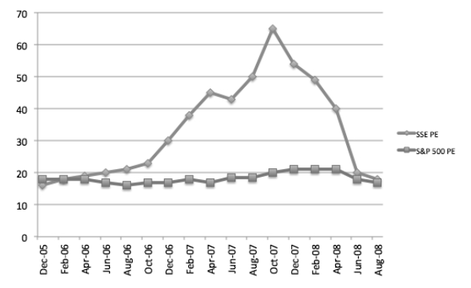
The other case that PE can fall is companies’ profitability, which is net income; thus, “earnings.” If companies’ earnings grow, PE should start to fall. Thus, either the decline in stock price or the increasing in earnings should have driven the multiple lower through 2005. During the first half of 2000s, China’s corporate sector profitability significantly increased (See Figure 3). The amount profit almost doubled from 2000 to 2005 and its growth rate was significant, especially after the WTO accession in 2001. Numerically, in the period of 2000-2005, the corporate profits increased from slightly below RMB 20 billion to RMB 40 billion. Yang, Zhang, and Zhou (2010) noted the privatization of state-owned enterprises (SOEs) and the growth of private enterprises were found to have induced more innovative efforts and raised the labor factor productivity of the corporate sector. After China’s WTO accession in 2001, external demand for goods and services produced in China rapidly increased while trade barriers and tariffs continued to fall. When exports were combined with equally remarkable foreign direct investment (FDI) inflows as well as the imports of sophisticated intermediate inputs, these factors jointly created a powerful force to increase firm productivity and profits. Therefore, a rapid increase in corporate earnings since China’s accession to the WTO should have been one of the factors that led the PE multiple down into 2005. However, if an increase in corporate earnings were kept as saving as China’s aggregate saving rates increased in 2000s, it was possible that corporate earnings were not distributed enough to investors as a form of dividends. During the first half of 2000s, China’s real interest continued to decline along with the stock market. However, in general, stock price and interest rates tend to have inverse relationship, which is usually seen in the developed financial market indices, such as the S&P 500. In China, interest rates and PE multiple had a positive correlation in the fist half of 2000s and the inverse relationship in the second half of 2000s (See Figure 4). As interest rates fall, businesses become profitable, and then, stock prices start to lift while PE multiple starts to cool down. However, Chinese stock markets in the fist half of 2000s performed in an opposite direction. A decrease in the real interest rates in China did help corporate earnings to improve significantly while it did not help stock prices to rise. Therefore, the PE multiple of the Shanghai Composite Index continued to decline due to a significant increase in the corporate profitability in the overall sector rather than overpricing in the stock prices. Overpricing or underpricing of stocks is indicative of market inefficiency, noted Li (2008). Since China’s stock market is relatively young with only 20 years in its history, it is not easy to value the stock market whether it is overpricing or underpricing. However, the Shanghai Composite Index should have been undervalued into 2005. Its PE multiple was trading only 15 times earnings while the U.S. benchmark, the S&P 500, was trading at around 18 times earnings in 2005(See Figure 5). At that time, the U.S. experienced a moderate economic growth after the IT bubble crash in 2001 and its economy grew around three percent. A determinant of PE is based on long-term “growth rate;” thus, why was the Chinese stock market trading “cheaper” than the U.S. stock market in 2005?
The PE ratio determines how much premiums investors are paying for a stock. In other words, lower PE means stocks are trading cheap. China’s economy grew 11 percent in 2005 while the U.S. economy grew only three percent in the same period. It clearly shows the Shanghai Composite was trading discount to the S&P 500 at least in 2005. Thus, the Shanghai Composite should have been traded discount largely and “underpriced.” On the other hand, the PE ratios in the early 2000s could be seen as “overpricing” while the ratios in 2003 and 2004 could be seen as fairly valued. However, stocks are always indicating the future state of the economy and corporate profitability. The Shanghai Composite should have traded into higher in the first half of 2000s rather than a quick lift-off in a 2006-2007 period. There must have the other forces that distort the movement of the Shanghai Composite because both macro- and micro-level economic condition were highly intact during the first half of 2000s and that condition should have allowed the Chinese stock market to perform well.
The second half of the 2000s was a dynamic ride for investors. Relatively undervalued Shanghai Composite in the mid-2000s created a skyrocketed momentum in a period of 2006-2007 with a 500 percent run. Some analysts believed it was the Chinese bubble but at least investors’ confidence was back into the market to create this bubble after five years of underperformance. When the market was hitting near all-time high in the end of 2007, the PE was trading well above 60 times earnings, which definitely created overpricing in the market. However, it quickly retreated in 2008 along with the global financial crisis. If there were no crisis that time, the PE could have been traded even higher along with the fast economic growth to create an even larger bubble. After the global financial crisis, China’s stock market headed even lower to below 2000 in November 2012 while the S&P 500 experienced a strong bear market rally in 2009 and created a historically long bull market into today. Again, the PE multiple of the Shanghai Composite traded into the lowest level in its history at 11.37 (as of Dec. 13, 2012) after a 33 percent underperformance in 2011 and a 5 percent underperformance as of today in 2012. While its PE trades at only 11.37 times, which is more than three multiple points lower than the S&P 500 (14.54 of as of Dec. 13, 2012), there must have some other factors that have brought the Chinese stock market underperformed in past years. Although the stock market is a future indicator of the economy, China’s stock market, in this case, the Shanghai Composite, should not be traded at that low today; otherwise, the market is inefficient enough to depress investors’ confidence. <Next Page - Market Inefficiency in Chinese Stock Markets> |
<Next Page>
<Previous Page>
More Articles on Investment
How to Beat the Market? Diversification: Systematic Risk and Unsystematic Risk Apple's Dividend Growth and Power of Compounding PE Multiple Analysis: How to Determine the Future Stock Price? The Great Gatsby and the Stock Market in the 1920s More Articles on China
Apple and Starbucks in Chengdu, China: Fast Growing Largest Inland Economy Apple and Starbucks in Chongqing, China: Price-Sensitive Inland Consumers Apple Store in Hangzhou, China: Popularity of Apple Products in China Starbucks in Changsha, China: Growing Upper Middle-Income Consumers Chinese ADRs: Is It Good to Buy Alibaba Shares? What is Middle-Income Trap? To visualize how today's economy looks like or stocks behave, Data in Universe offers graphs and figures established through various sources.
>> Data in Universe |
