Data in Universe
Data give you a visual idea how today's economy shapes and stocks behave in the markets.
U.S. Federal Funds Rate between 2001 and 2012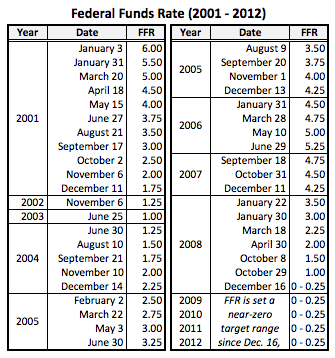
Source: U.S. Department of the Treasury
China: Quarterly GDP Growth (2011-2014)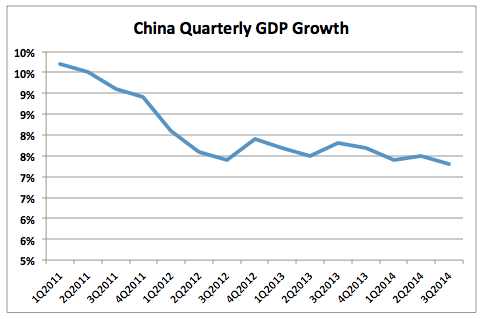
Source: National Bureau of Statistics of China
China: Consumer Price Index (2012-2014)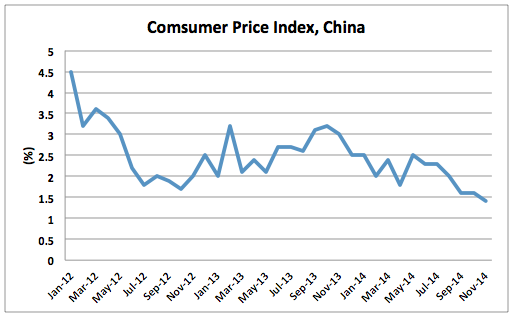
Source: National Bureau of Statistics of China
China: Official Manufacturing PMI (2012-2014)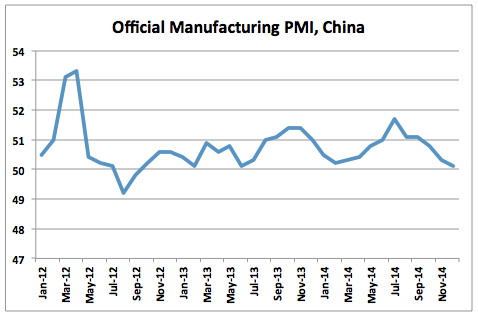
Source: National Bureau of Statistics of China
China: Imports and Exports (2012-2014)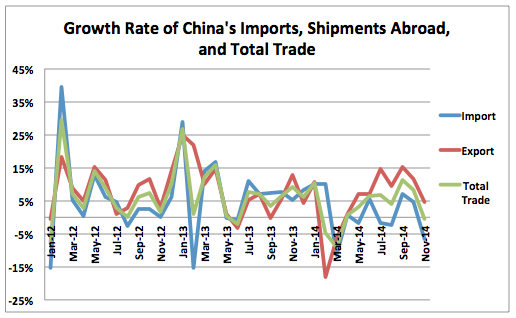
Source: National Bureau of Statistics of China
Liquidity Trap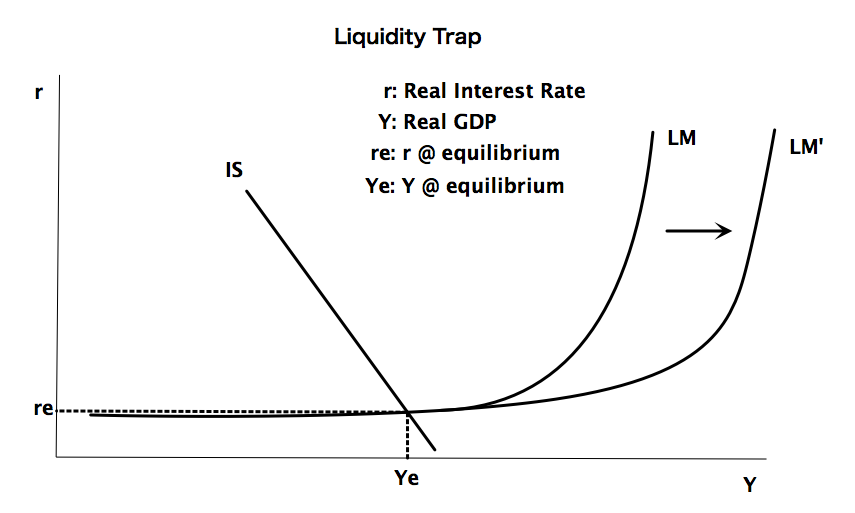
|
Apple's Geographical Revenues and Weights (2012-2015)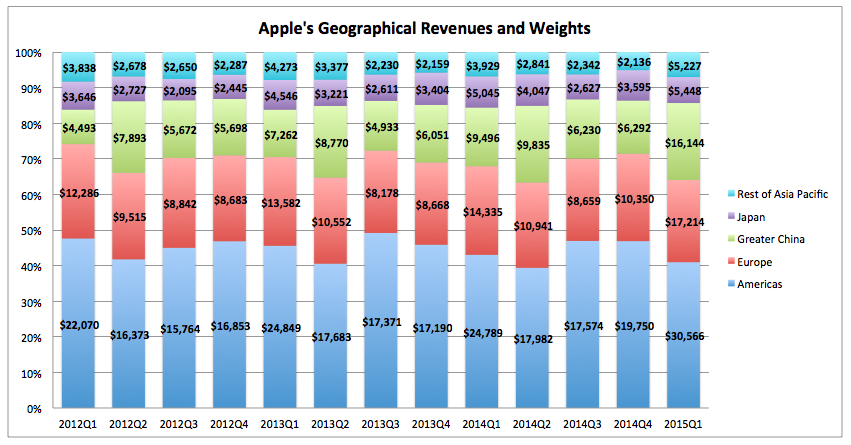
Source: Apple Inc.
Diversification: Systematic and Unsystematic Risks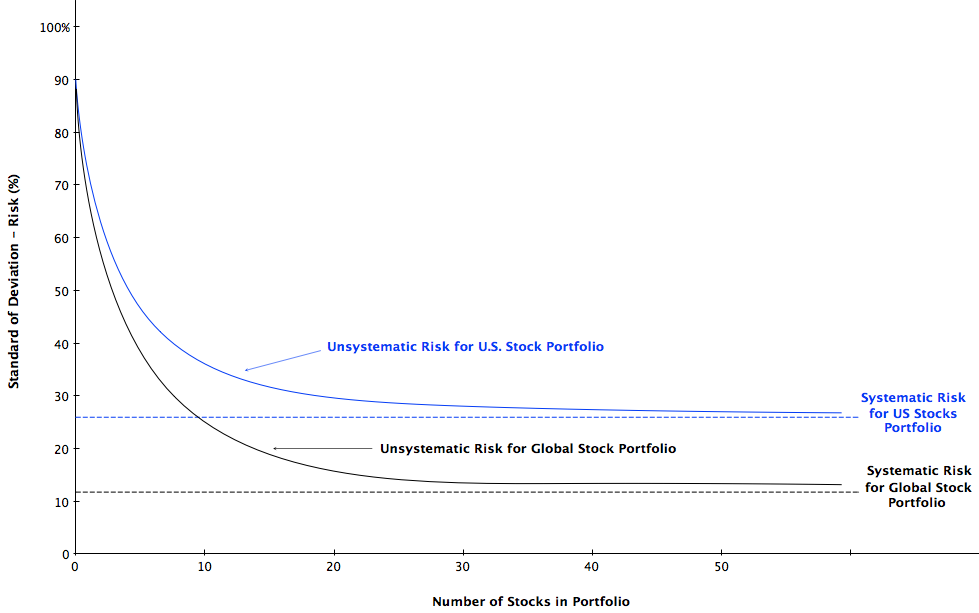
Starbucks Store Counts by Asian Countries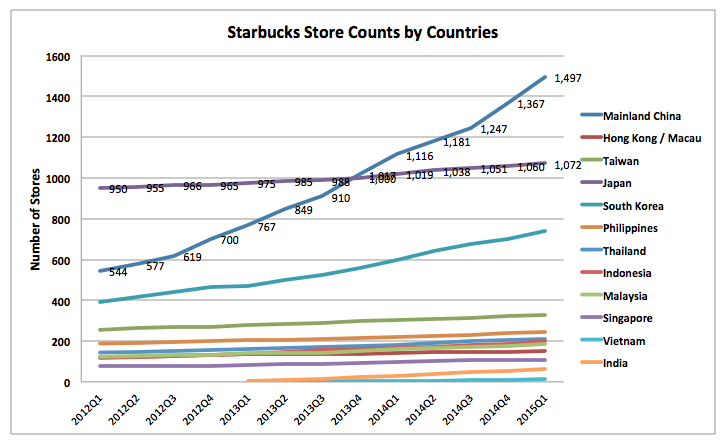
Source: Starbucks
Starbucks Historical Dividends (2010-1015)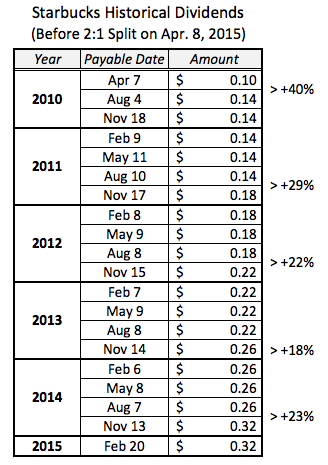
Source: Starbucks Investor Relations
McDonald's Annual Dividend Growth (2003-2013)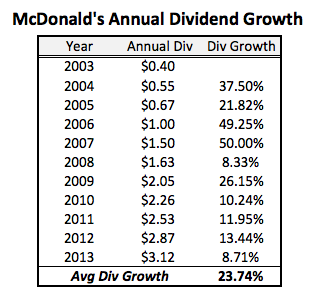
Source: NASDAQ
Basic Economic & Starbucks Data in China and Thailand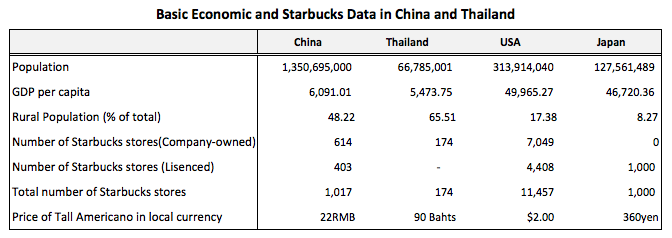
Sources: World Bank, Starbucks Annual Report (2013)
|
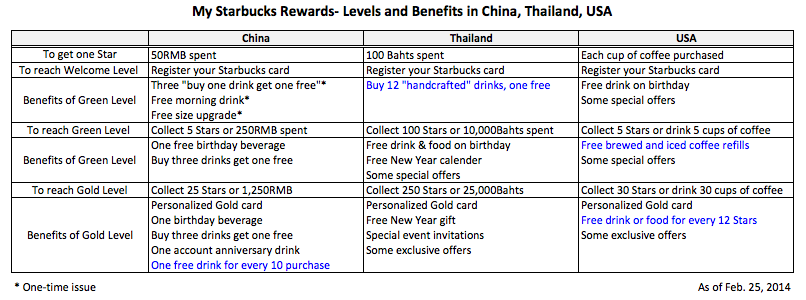
My Starbucks Rewards - Levels of Benefits in China, Thailand, and USA