What is Yield Curve?
(Original article: How Do Stock Markets React when the Yield Curve Changes?)
February 1, 2019
Akira Kondo
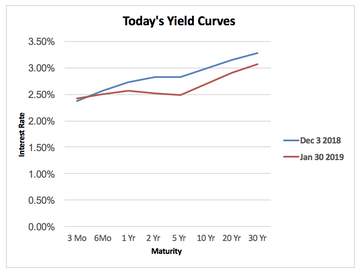
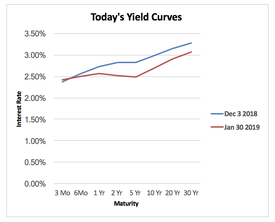 Today's yield curves are shaping flatter but still remain normal shape. Today's yield curves are shaping flatter but still remain normal shape.
The yield curve, which is one of my favorite economic indicators, describes how the economy is doing right now and into the future. It is a collection of interest rates from the shorter maturities, such as treasury bills as known as T-bills, to the longer maturities, like 30-year government bonds. This is probably the best economic indicator that you can utilize when learning today’s as well as future’s economy and the stock market movement. Personally, I would not have performed well on my investment portfolio during the financial crisis period if I did not know what the yield curve was. Unfortunately, a basic Economics class does not teach this yield curve in details, so does the intermediate Economics course, which not many students are willing to register unless they are majoring in Economics.
Again, the yield curve is a collection of interest rates. The rates start off with the shortest maturity three-month interest rate, which is often known as federal funds rate or T-bills. It is the key rate that the Federal Reserve Bank Chairman always keeps eyeing on and controls it depending on the state of the economy. Then, you see the six-month or one-year interest rates while they are still considered to be shorter maturity treasuries. After that, maturities get longer into two years, five years, ten years, 20 years, and all the way up to the longest maturity, 30 years.
When you plot all the rates while an x-axisis maturity and a y-axisis an interest rate, you will see, today in the real world, almost “flat” yield curve. The term, “flat,” means the curve is flat, while the interest rate gap is narrower between shorter rates and longer rates. In fact, the curve is still a moderate upward slope, meaning longer rates are slightly higher than shorter rates. Today in the real world, the current Fed Chairman, Jerome Powell preceded byJanet Yellen, continues a gradual rate hike approach since his inception in the office back in February 2018. While longer rates have been moving sideways, the three-month interest rates controlled by the Fed now hit 2.25 – 2.50 percent and it makes the yield curve flatter today.
Steep yield curve
What does this steep yield curve tell us? The answer is the economy is recovering. You will see this steep yield curve after the economy is really hit hard. We have been at just a couple of years after the global financial crisis. Over the past years, the former Fed Chairman, Ben Bernanke, brought the short-term interest rates all the way down close to zero after hiking the rates all the way up to 5.25 percent in June 2006, until the Fed lowered the rate to 4.75 in September 2007. 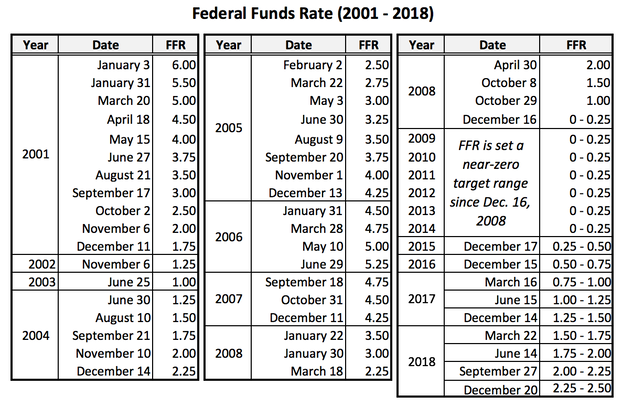
Source: U.S. Department of the Treasury
When the economy is in trouble, the central bank cuts the interest rates to attract business activities. At the lower interest rates, companies can borrow money at a lower cost so that they can invest in new or existing projects to generate more revenues/profits as well as employment. For the individuals, they can loan expensive goods, like a car and a home, at lower APRs or mortgage rates. The drawback is that the money in a saving account will not grow at near-zero interest rates.
There have been two periods when the yield curve was steep in 2000s. The first one was right after the post Dot-com recession in 2003while the second one was right after the financial crisis in 2009. During those times, the economy was really hit hard and the Federal Reserve had to cut interest rates to stimulate the economy. When the economy seems hitting bottom or the yield curve is steep, the reaction of the stock markets gets intense. Investors start to buy or buy back shares from banking to technology to take advantage of cheaper stock prices and gain the optimism that the economy will recover momentarily.
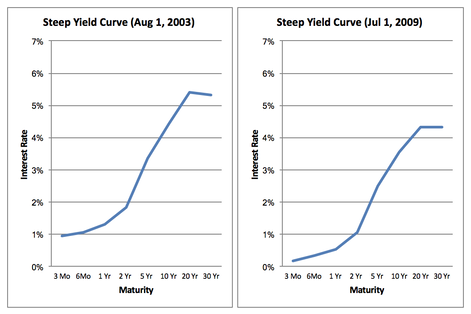
During a recessionary period, such as in 2003 and 2009, the yield curve is steeper. Source: U.S. Department of the Treasury
Normal yield curve After all the dust starts to settle down after a recession, the yield curve gradually heads back to “normal.” The normal yield curve shapes upward sloping but not steep anymore, meaning the interest rate gap between shorter-term rates and a longer-term ten-year treasury is narrower, for instance around a 2 percent gap. Since the post Dot-com recession, the yield curve has started to become normal as the Fed gradually increased its three-month interest rate. When the Fed navigated the federal funds rateto 1 percent in June 2003 from the previous 1.25 percent in November 2002, the yield curve was forming a steep shape. As business activities were slowly back in swing in 2004, the Fed started to raise interest rates incrementally by a quarter percentage point all the way to 5.25 percent in the mid-2006 until the yield curve no longer shaped normal. On the other hand, longer-term rates remained higher, compared to today’s historically low long-term rates thanks to falling expectations for future inflation. In the meantime, the Federal funds rate started to pick up and the yield curve normalized by 2004.
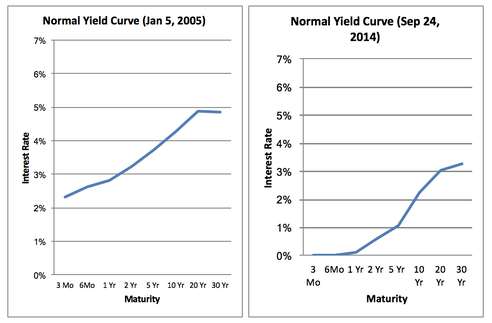
After the post Dot-com recession, the yield curve normalized as the Fed started hike the interest rates. On the other hand, today's yield curve looks like normal. While the Fed's near-zero policy since 2009 makes the three-month interest rate on the ground, the long-term interest rates are hitting historically low, which actually makes the yield curve's shape normal. Source: U.S. Department of the Treasury
The reaction of the stock markets after the post Doc-com recession was positive and lasted for more than several years (Dow Jones Industrial Average (DJIA) climbed to 14,000 in October 2007, nearly 6,000 points from 8,000 in the beginning of 2003). On the other hand, the DJIA jumped nearly 17,000 points to above 23,000 today (as of end of December 2018) from around 6,500 in March 2009 after the yield curve formed from steep to normal today (or nearly flat).
**While this article covers stock market reactions over the yield curve movements, it is one of the best references to read about the article “why are long-term interest rates so low?” written by the former Fed chairman, Ben Bernanke, if you are interested in the answer. The site is listed in the bottom of this page under the sources.
Inverted yield curve
When the economy starts to heat up as business activities are firing all cylinders, the Fed prepares to raise interest rates. Sometimes the interest rate hike gets intense, especially the central bank thinks some economic bubbles appear in the market. During 2005, the Fed hiked its federal funds rate eight times from 2.5 percent to 4.25 percent and another 0.75 percent hike to 5.25 percent in 2006, the highest level since the Dot-com bubble in 2000. By the end of 2006, the yield curve became “inverted,” meaning the curve is almost flat or the short-term interest rates are higher than the longer-term interest rates. This is the sign that investors really need to get very cautious about the stock markets. During the Dot-com bubble in 2000 or before the financial crisis in 2006-2007, the yield curve was inverted. The Fed kept raising its short-term three-month interest rate to cool down the economy or the bubbles (Dot-com and housing). In the beginning of 2001, the federal funds rate was at 6.5 percent or far higher than the highest rate of 5.25 percent in the end of 2006.
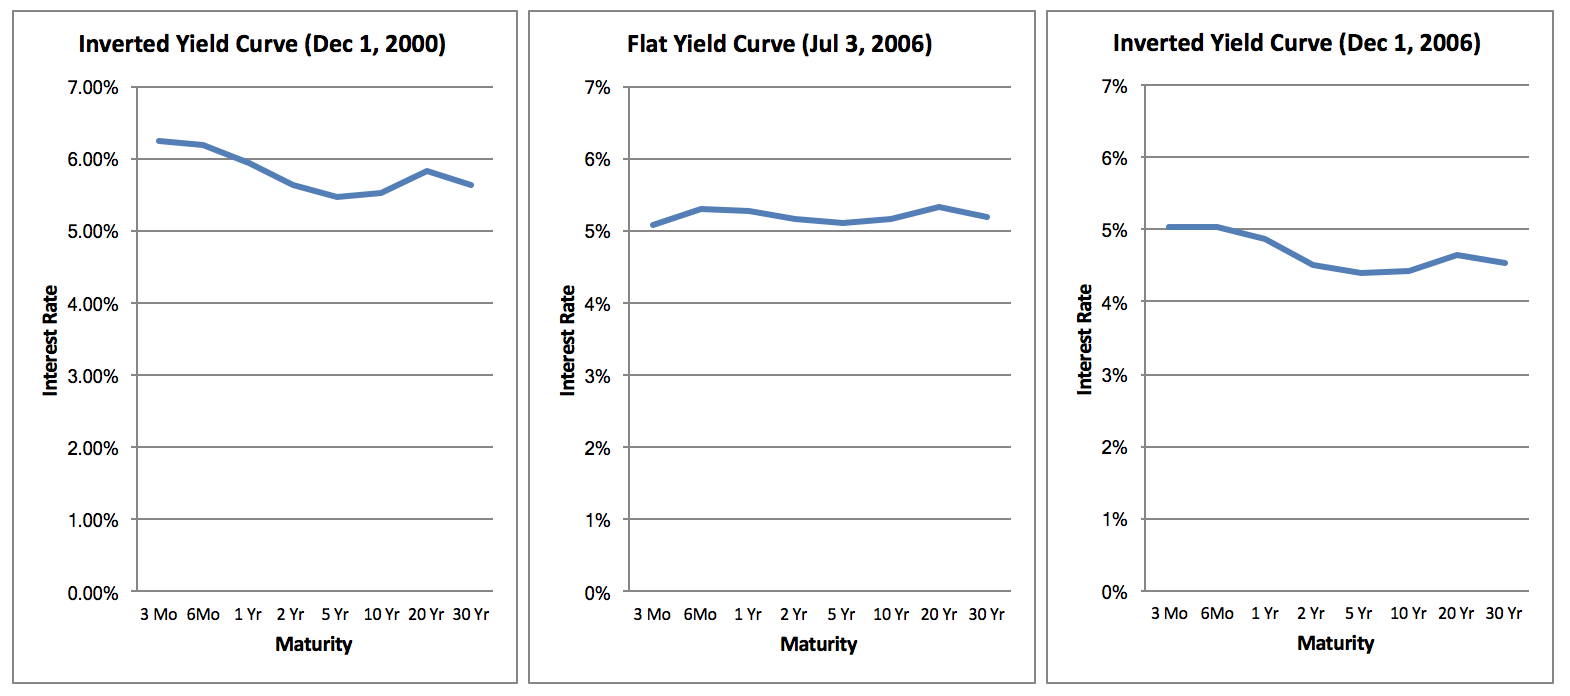
Before the stock markets crash, the yield curve tends to become inverted. It is probably the sign that investors need to prepare staying away from the stock markets. Source: U.S. Department of the Treasury
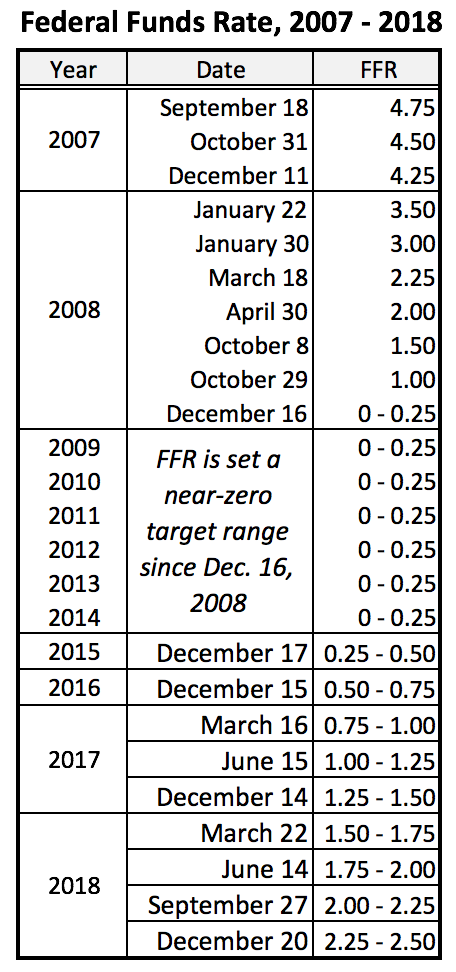
The Fed very cautiously managed its interest rates during the housing bubble from the lesson learned from the Dot-com bubble. Soon later, the history continued and the Fed started to cut interest rates gradually in 2007 while the yield curve also gradually shaped back to normal. In 2008, the Fed dramatically lowered the interest rates from 3.5 percent all the way to a near-zero rate, which has continued till today.
On the other hand, investors positively played the stock markets even the sign of the inverted yield curve already turned on during 2006. In October 2007, the DJIA hit the all-time high in the Wall Street history, the right above 14,000. Investors were optimistic that the economic slowdown would be tentative and did not expect to be the worst financial crisis in history.
Back on June 27, 2001, the Fed cut interest rates to 3.75 percent for the sixth time that year after the yield curve had been inverted during 2000. Investors at that time had already seen the sign of a recession after seeing the inverted yield curve. San Francisco Chronicle on June 28, 2001, wrote, “The latest cut comes at a time when the economy is on a knife edge. Economists say it is unclear whether business conditions are poised for recovery or will fall into a full-blown recession.” June 28 was the time when the inverted yield curve was back to normalize as the Fed was on its way to cut down the interest rates while the stock markets were descending sharply. Investors and economists believed that once the yield curve inverted, the chances were very high that the economy would head down to a recession. Soon later, the stock market started to nosedive as a gravity to the ground increased. By the end of 2002, almost two years after the yield curve inverted, the DJIA dropped about 3,800 points within 18 months from 11,300 in May 2001. As you start to see the yield curve flattening and inverted, it is probably the time that a “full-blown recession” is coming right ahead. 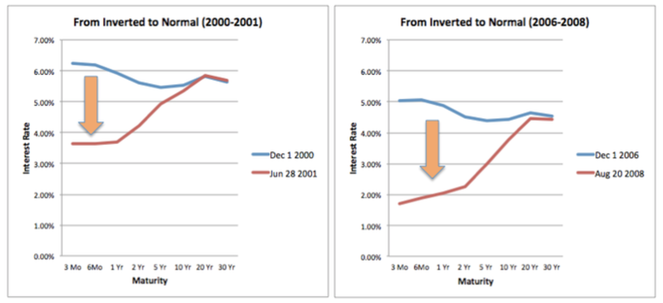
Once the yield curve inverted, the stock markets are becoming falling knives. The yield curve is back to normalize as the Fed lowers the interest rate and soon becomes steep. Source: U.S. Department of the Treasury
In October 2007, as soon as the inverted yield curve started back to normalize as the central bank gradually cut interest rates from the peak of 5.25 percent, the stock markets became falling knives. Those knives fell faster and faster in 2008 as investors were afraid of catching them as their hands might have dangerously got hurt. The DJIA nosedived from the all-time high above 14,000 to below 6,600 just within 18 months or until the yield curve steepened. By the time the DJIA was hitting the bottom in the early 2009, the yield curve was steep and soon later the stock markets gained momentum.
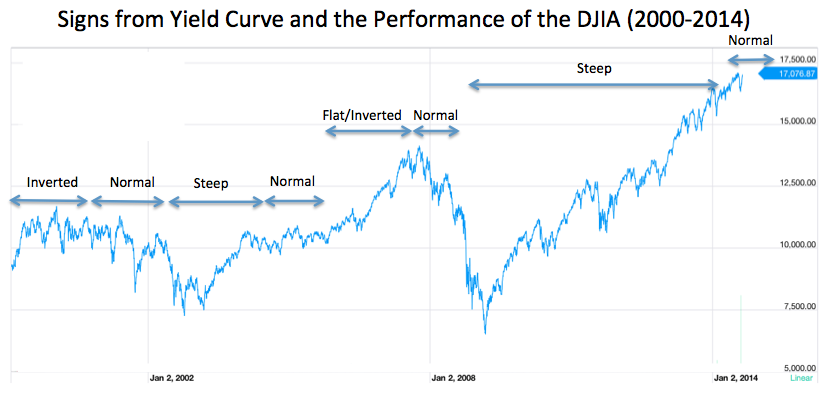
Taking advantage of the signs from yield curve is one of the ways to perform your investment portfolio better. Source: Yahoo! Finance (DJIA chart)
Recently, the yield curve becomes flatter from normal. Financial news mentioned the first inversion of the yield curve earlier last December but it was, in fact, an inversion between 3- and 5-year treasuries, not an inversion seen in the past when longer the long-term interest rates, such as 30-year, were less than the three-month interest rates. Investors responded the news quickly to intensify the sell-offs in the broader markets, sending DJIA to fall more than 3,000 points to 52-week low in the Christmas holiday from the news hit the markets in earlier December. However, the stock market dive in the last quarter of 2018 was more like due to the trade war between the U.S. and China and China’s slowing economy, followed later by Apple’s warning about slowing Chinese economy earlier this year (which led DJIA to fall sharply once again in the session on January 3, 2019). That being said, the real inverted yield curve has not shown yet but the shape of the yield curve is now getting flatter.
Three signs from the yield curve are probably are the most reliable economic indicators among hundreds of economic indicators available in the universe. An each of normal, steep, and inverted yield curves gives you a better idea of what today’s economy is like, what the future economy is going to be, and how the future stock markets are going to behave. Investors need to be very cautious when the yield curve gets flatter and inverted. It is probably the best chance that you can stay away for the upcoming falling stock markets. Statistically, “the probability of recession is 25 percent if once the yield curve flattens and both the three-month bill and the 10-year Treasury bond have essentially have the same yield” and “the odds of an economic slowdown is 90 percent and will materialize within the next 18 months if the yield curve ends up inverted, where the yield on three-month bills stands 2.4 percentage points above the 10 year-bond.” (p. 323) That being said, an upcoming recession is unavoidable once the yield curve is inverted.
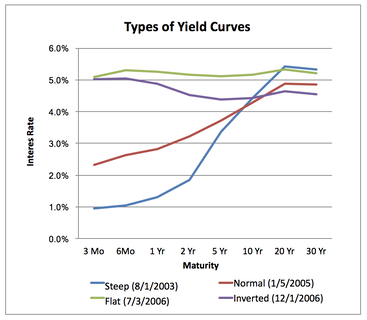
Four types of yield curves were formed from 2003 to 2006. Source: U.S. Department of the Treasury
Therefore, taking advantage of the yield curve movements is one of the ideas to perform your investment portfolio better. Put it simply, it is probably the best chance to stay away from the markets as you start to see a flatter or inverted yield curve. If you are wise enough during the yield curve being flatten or inverted, you can start to decrease your stock positions while deploying some sales of the stocks to own some defensive names that consistently pay you dividends in a possible following recession. Cash will be far important after the stock markets are going to be totally blown up. The risk of not buying stocks will be greater after the yield curve gets steeper. It is the time you start slowly building up stock positions once again to enjoy the stock market momentum while the yield curve is steep until near-inverted via normal.
|
 Source: U.S. Department of the Treasury Source: U.S. Department of the Treasury
* To have a better picture about the yield curve and the following paragraphs, check out the Dynamic Yield Curve at https://stockcharts.com.
This site will help you understand how the yield curve shapes along with changes in interest rates and the relation between the yield curve and the stock market. 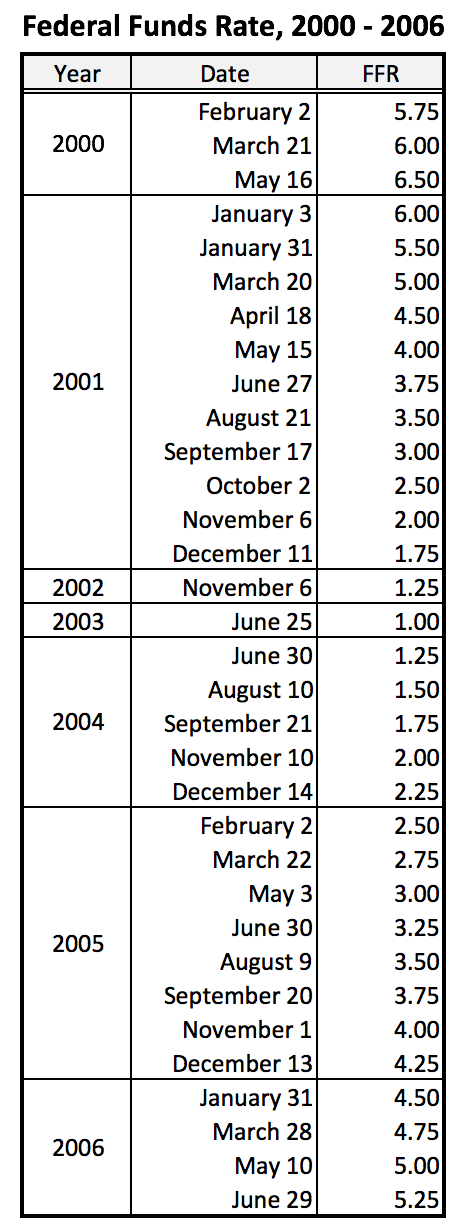
Source: U.S. Department of the Treasury
Source: U.S. Department of the Treasury

About the author: Akira Kondo
Akira Kondo received his Bachelor's degree from the University of California, Berkeley, in 2005 and also received his post-degree certificates in Business Administration and Finance in 2007. In 2013, he completed his Master's degree in Economics at Fudan University, Shanghai China. He is currently a contributor for many articles, including Economics Universe, while he is also a frequent traveler as he is a United Airlines' one-million-mile flyer, who travels often to San Francisco, New York, Shanghai, Singapore, and Bangkok.
His academic interests are economics and finance, particularly investment. He started off with his equity portfolio investment in the U.S. stock markets in 2003 and enjoyed several outperformances over the S&P 500 benchmark till 2007. Since 2008, his fairy diversified portfolio has been outperforming the S&P 500 every year. Sources:
Baumohl, Bernard (2008), “The Secrets of Economic Indicators: Second Edition,” Wharton School Publishing. Bernanke, Ben S. (March 1, 2013), “Long-Term Interest Rates - Remarks by Ben S. Bernanke,” Board of Governors of the Federal Reserve System. www. San Francisco Chronicle (June 28, 2001), “Bid to boost economy – Fed shaves rates.” StockCharts.com, “Dynamic Yield Curve.” www.stockcharts.com. U.S. Department of the Treasury, “Daily Treasury Yield Curve Rates,” http://www.treasury.gov/resource-center/data-chart-center/interest-rates/Pages/TextView.aspx?data=yield. Yahoo! Finance, “Chart of the Dow Jones Industrial Average,” www.finance.yahoo.com. |